 Koen Heye Blog
Practical SitecoreAI Extensions, part 2: Mouseflow

🎄 This is part 2 of 3 of a proof of concept I wrote for the Sitecore Community Advent Calendar 2025, where it was published as one post on 15 December 2025.
This series:
- Part 1: Google PageSpeed Insights
- Part 2: Mouseflow (this post)
- Part 3: Atlassian Confluence
In part 1 I introduced the Sitecore Marketplace and built a Google PageSpeed dashboard widget. This part shows Mouseflow heatmap data in SitecoreAI, using the same approach.
Mouseflow
Mouseflow is a tool that our marketeers use for understanding heatmaps of pages to understand where users are clicking, scrolling or moving around on their website. Have a look at their website to get more info.
Here is an example of a heatmap result. It measures visit time, engagement, clicks, render time, scroll time...
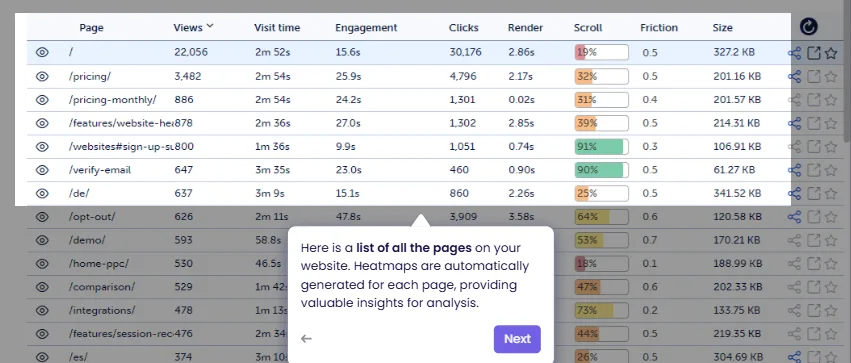
Now they have to log in into their platform to see the results. But it would be nice to have this integrated into SitecoreAI.
Providing a more direct loopback feed on how certain pages are performing.
Step 0: Extension point starter
We'll be using the same extension point as the Google PageSpeed integration: dashboard-widget-extension
Step 1: Create API key for Mouseflow
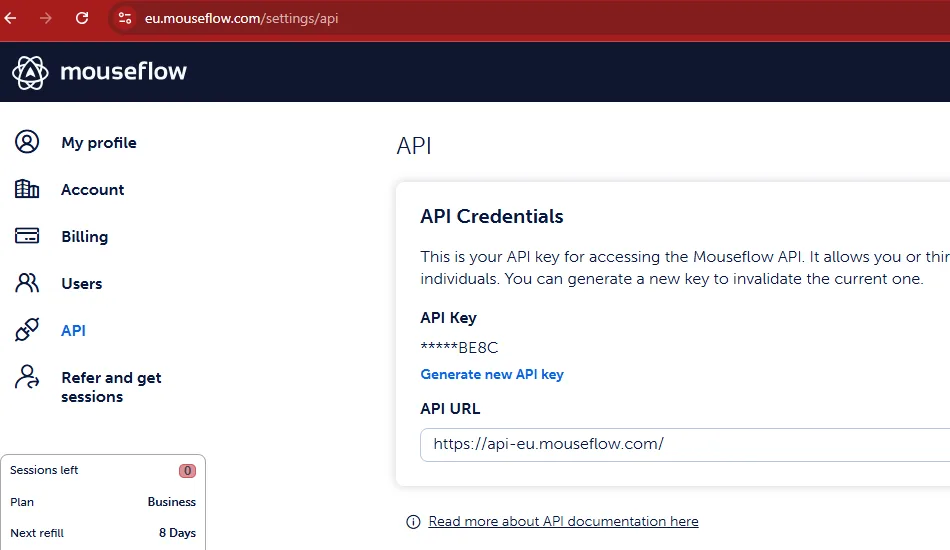
On the /settings/api page, you can generate an api key.
Step 2: environment variable
I've configured 3 settings in the .env file for Mouseflow. We need the account email, the api key and a website identifier as found in the mouseflow environment.
MOUSEFLOW_EMAIL=your-email-account
MOUSEFLOW_API_KEY=your-api-key
MOUSEFLOW_WEBSITE_ID=your-mouseflow-website-id
For multisite setup in Sitecore, we should use a configuration item so that we can easily integrate across multiple websites.
Step 3: define a type
We create an interface that will hold the data retrieved from Mouseflow for a specific page. This information was fetched from the documentation: https://api-docs.mouseflow.com/#heatmaps Note that I didn't include all properties since I wanted to limit them.
File created: src/types/HeatmapPage.ts
export interface HeatmapPage {
  displayUrl: string;
  views: number;
  visitTime: number; // in ms
  clicks: number;
  scroll: number; // percentage
  friction: number;
  size: number; // in bytes
}
Step 4: define a component
The component will render our data in the application. I'm choosing for a basic table that will list the results.
File created: src/components/HeatmapTable.ts
We need 2 helper functions: formatTime and formatSize to display these properties correctly.
'use client';

import { HeatmapPage } from '../types/heatmap';

interface Props {
  data: HeatmapPage[];
}

function formatTime(ms: number): string {
  const sec = Math.floor(ms / 1000);
  const min = Math.floor(sec / 60);
  const remSec = sec % 60;
  return min > 0 ? `${min}m ${remSec}s` : `${remSec}s`;
}

function formatSize(bytes: number): string {
  return bytes > 1024 * 1024
    ? `${(bytes / (1024 * 1024)).toFixed(2)} MB`
    : `${(bytes / 1024).toFixed(2)} KB`;
}

export default function HeatmapTable({ data }: Props) {
  return (
    <table style={{ width: '100%', borderCollapse: 'collapse', marginTop: '2rem' }}>
      <thead>
        <tr>
          <th>Page</th>
          <th>Views</th>
          <th>Visit Time</th>
          <th>Click</th>
          <th>Scroll</th>
          <th>Friction</th>
          <th>Size</th>
        </tr>
      </thead>
      <tbody>
        {data.map((page, idx) => (
          <tr key={idx}>
            <td>{page.displayUrl}</td>
            <td>{page.views}</td>
            <td>{formatTime(page.visitTime)}</td>
            <td>{page.clicks}</td>
            <td>{page.scroll}%</td>
            <td>{page.friction}</td>
            <td>{formatSize(page.size)}</td>
          </tr>
        ))}
      </tbody>
    </table>
  );
}
Step 5: Define our server side API endpoint
For calling the Mouseflow api, we use a server side route: /api/mouseflow
File created: src/app/api/mouseflow/route.ts
This route will:
- build the authentication base 64 string
- call the Mouseflow api endpoint /pagelist
- convert the response into a HeatmapPage array: HeatmapPage[] = data.pages.map
// src/app/api/heatmaps/route.ts
import { NextRequest } from 'next/server';
import { HeatmapPage } from '@/src/types/heatmap';

export async function GET(req: NextRequest) {
  const API_ENDPOINT = 'https://api-eu.mouseflow.com/websites';
  const auth = Buffer.from(`${process.env.MOUSEFLOW_EMAIL}:${process.env.MOUSEFLOW_API_KEY}`).toString('base64');

  try {
    const res = await fetch(`${API_ENDPOINT}/${process.env.MOUSEFLOW_WEBSITE_ID}/pagelist`, {
      headers: {
        Authorization: `Basic ${auth}`,
      },
    });

    if (!res.ok) throw new Error('Mouseflow API error');

    const data = await res.json();
    const pages: HeatmapPage[] = data.pages.map((page: any) => ({
      displayUrl: page.displayUrl,
      views: page.views,
      visitTime: page.visitTime,
      clicks: page.clicks,
      scroll: page.scroll,
      friction: page.friction,
      size: page.size,
    }));

    return new Response(JSON.stringify(pages), { status: 200 });
  } catch (err) {
    return new Response(JSON.stringify({ error: 'Failed to fetch heatmaps' }), { status: 500 });
  }
}
Step 6: Bringing it all together
Again, for we'll always need a page.tsx file to have our widget in SitecoreAI.
Created file: src/app/dashboard-widget-mouseflow/page.tsx
We import our component HeatmapTable and our type HeatmapPage. And we'll add a HeatmapPage array to our state.
We call our server side api endpoint to fetch the heatmap data:
fetch('/api/mouseflow').then((res) => res.json().then((data) => setHeatmapData(data)));And we pass that data to our component:
    <h1>🔥 Heatmaps</h1>
    <HeatmapTable data={heatmapData} />
Full code sample:
"use client";

import { useEffect, useState } from "react";
import { useMarketplaceClient } from "@/src/utils/hooks/useMarketplaceClient";
import { ApplicationContext } from "@sitecore-marketplace-sdk/client";

import HeatmapTable from '../../components/heatmaptable';
import { HeatmapPage } from "@/src/types/heatmap";

function DashboardWidget() {
  const { client, isInitialized, error } = useMarketplaceClient();
  const [appContext, setAppContext] = useState<ApplicationContext>();
  const [heatmapData, setHeatmapData] = useState<HeatmapPage[]>([]);

  useEffect(() => {
    if (!error && isInitialized && client) {
      console.log("Marketplace client initialized successfully.");
      // Make a query to retrieve the application context
      client.query("application.context")
        .then((res) => {
          console.log("Success retrieving application.context:", res.data);
          setAppContext(res.data);
        })
        .catch((error) => {
          console.error("Error retrieving application.context:", error);
        });

        fetch('/api/mouseflow').then((res) => res.json().then((data) => setHeatmapData(data)));

    } else if (error) {
      console.error("Error initializing Marketplace client:", error);
    }
  }, [client, error, isInitialized]);

  return (
    <div>
      {isInitialized ? (
        <>
        <h1>🔥 Heatmaps</h1>
        <HeatmapTable data={heatmapData} />
        </>
      ) : (
        <p>Loading widget...</p>
      )}
      {error && <p style={{ color: "red" }}>Error: {String(error)}</p>}
    </div>
  );
}

export default DashboardWidget;
Mouseflow integration summary
This setup was much easier than the Google PageSpeed one since I already had that working. And basically the same steps were necessary for Mouseflow. It does help that their documentation is very clear as well.
What can be improved:
- move mouseflow website id to a Sitecore configuration template & item
- better and modern styling
- I need some input on what data is most useful and needed by our marketeers to know exactly which data they need.
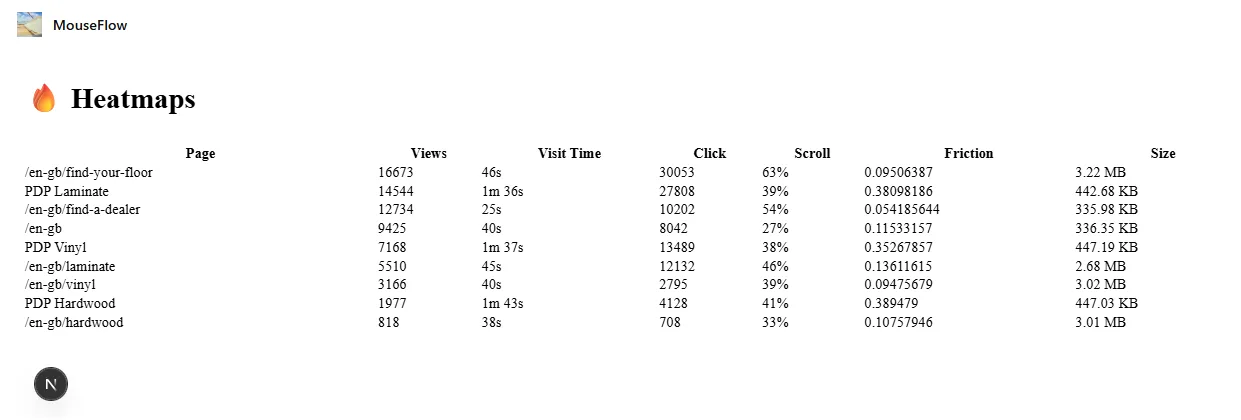
Screenshots of working example
Bonus styling update
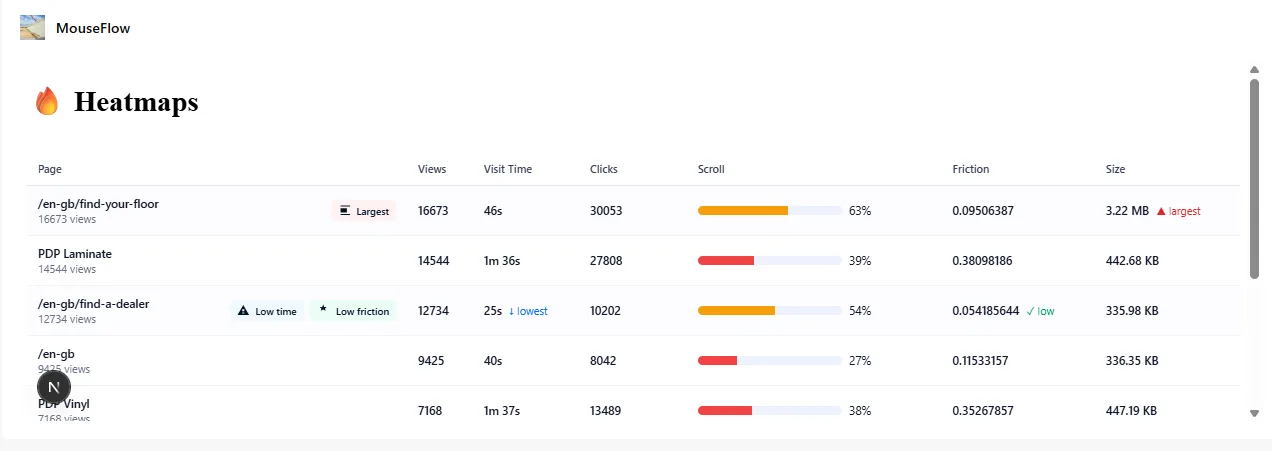
I asked Copilot for help on styling the results. So I don't want to take any credit on this at all.
Prompt:
I have this integration in react for displaying data from the Mouseflow api found here: https://api-docs.mouseflow.com/#heatmap-page-list
I want to know how to enhance the display of the rendered table. Since this is a bit boring right now and only contains text. Can this be enriched for example with:
- icon for lowest visit time
- icon for lowest click
- a 0 to 100% bar with the number for scroll information
- icon for lowest friction
- icon for highest size
Which resulted in an updated components/heatmaptable.tsx file. No other changes were needed. It does include inline css styling though.
// components/heatmaptable.tsx
'use client';

import React, { useMemo } from 'react';
import { HeatmapPage } from '../types/heatmap';

interface Props {
  data: HeatmapPage[];
}

function formatTime(ms: number): string {
  const sec = Math.floor(ms / 1000);
  const min = Math.floor(sec / 60);
  const remSec = sec % 60;
  return min > 0 ? `${min}m ${remSec}s` : `${remSec}s`;
}

function formatSize(bytes: number): string {
  return bytes > 1024 * 1024
    ? `${(bytes / (1024 * 1024)).toFixed(2)} MB`
    : `${(bytes / 1024).toFixed(2)} KB`;
}

/* Small inline SVG icons */
const IconTrophy = ({ title = 'Best' }: { title?: string }) => (
  <svg width="16" height="16" viewBox="0 0 24 24" aria-hidden focusable="false" role="img" title={title}>
    <path fill="currentColor" d="M12 2l1.5 4.5L18 7l-3 2 1 4-4-2-4 2 1-4-3-2 4.5-.5L12 2z" />
  </svg>
);

const IconWarning = ({ title = 'Lowest' }: { title?: string }) => (
  <svg width="14" height="14" viewBox="0 0 24 24" aria-hidden focusable="false" role="img" title={title}>
    <path fill="currentColor" d="M1 21h22L12 2 1 21zm13-3h-4v-2h4v2zm0-4h-4v-4h4v4z" />
  </svg>
);

const IconSize = ({ title = 'Largest' }: { title?: string }) => (
  <svg width="14" height="14" viewBox="0 0 24 24" aria-hidden focusable="false" role="img" title={title}>
    <path fill="currentColor" d="M3 3h18v2H3V3zm0 16h18v2H3v-2zM3 8h12v8H3V8z" />
  </svg>
);

/* Styles kept inline for simplicity and encapsulation */
const tableStyle: React.CSSProperties = {
  width: '100%',
  borderCollapse: 'collapse',
  marginTop: '1rem',
  fontFamily: 'Inter, ui-sans-serif, system-ui, -apple-system, "Segoe UI", Roboto, "Helvetica Neue", Arial',
  fontSize: 13,
  color: '#0f172a',
};

const thStyle: React.CSSProperties = {
  textAlign: 'left',
  padding: '10px 12px',
  borderBottom: '1px solid #e6e9ef',
  fontWeight: 600,
  fontSize: 12,
  color: '#334155',
};

const tdStyle: React.CSSProperties = {
  padding: '10px 12px',
  borderBottom: '1px solid #f1f5f9',
  verticalAlign: 'middle',
};

const smallMuted: React.CSSProperties = {
  fontSize: 12,
  color: '#667085',
};

const badgeStyle = (bg: string): React.CSSProperties => ({
  display: 'inline-flex',
  alignItems: 'center',
  gap: 6,
  background: bg,
  color: '#021124',
  padding: '4px 8px',
  borderRadius: 6,
  fontSize: 12,
  fontWeight: 600,
});

/* Scroll bar component */
function ScrollBar({ value }: { value: number }) {
  const clamped = Math.max(0, Math.min(100, Math.round(value)));
  const trackStyle: React.CSSProperties = {
    height: 10,
    background: '#eef2ff',
    borderRadius: 999,
    overflow: 'hidden',
    width: 160,
    display: 'inline-block',
    verticalAlign: 'middle',
    marginRight: 8,
  };
  const fillStyle: React.CSSProperties = {
    width: `${clamped}%`,
    height: '100%',
    background: clamped > 75 ? '#16a34a' : clamped > 40 ? '#f59e0b' : '#ef4444',
    transition: 'width 300ms ease',
  };
  return (
    <div style={{ display: 'flex', alignItems: 'center' }}>
      <div style={trackStyle} aria-hidden>
        <div style={fillStyle} />
      </div>
      <div style={{ fontVariantNumeric: 'tabular-nums', minWidth: 36 }}>{clamped}%</div>
    </div>
  );
}

export default function HeatmapTable({ data }: Props) {
  const stats = useMemo(() => {
    if (!data || data.length === 0) return null;
    // compute mins and maxes
    let minVisit = data[0], minClicks = data[0], minFriction = data[0], maxSize = data[0];
    for (const p of data) {
      if (p.visitTime < minVisit.visitTime) minVisit = p;
      if (p.clicks < minClicks.clicks) minClicks = p;
      if (p.friction < minFriction.friction) minFriction = p;
      if (p.size > maxSize.size) maxSize = p;
    }
    return {
      minVisitUrl: minVisit.displayUrl,
      minClicksUrl: minClicks.displayUrl,
      minFrictionUrl: minFriction.displayUrl,
      maxSizeUrl: maxSize.displayUrl,
    };
  }, [data]);

  return (
    <div style={{ overflowX: 'auto' }}>
      <table style={tableStyle} role="table" aria-label="Mouseflow heatmap summary">
        <thead>
          <tr>
            <th style={thStyle}>Page</th>
            <th style={thStyle}>Views</th>
            <th style={thStyle}>Visit Time</th>
            <th style={thStyle}>Clicks</th>
            <th style={thStyle}>Scroll</th>
            <th style={thStyle}>Friction</th>
            <th style={thStyle}>Size</th>
          </tr>
        </thead>

        <tbody>
          {data.map((page, idx) => {
            const isMinVisit = stats?.minVisitUrl === page.displayUrl;
            const isMinClicks = stats?.minClicksUrl === page.displayUrl;
            const isMinFriction = stats?.minFrictionUrl === page.displayUrl;
            const isMaxSize = stats?.maxSizeUrl === page.displayUrl;

            const rowHighlight: React.CSSProperties = {
              background: isMinVisit || isMinClicks || isMinFriction || isMaxSize ? '#fcfcfe' : 'transparent',
            };

            return (
              <tr key={idx} style={rowHighlight}>
                <td style={{ ...tdStyle, minWidth: 220 }}>
                  <div style={{ display: 'flex', gap: 8, alignItems: 'center' }}>
                    <div style={{ flex: 1 }}>
                      <div style={{ fontWeight: 600 }}>{page.displayUrl}</div>
                      <div style={smallMuted}>{page.views} views</div>
                    </div>

                    <div style={{ display: 'flex', gap: 6, alignItems: 'center' }}>
                      {isMinVisit && (
                        <div title="Lowest average visit time" style={badgeStyle('#f0f9ff')}>
                          <IconWarning /> <span style={{ fontSize: 11 }}>Low time</span>
                        </div>
                      )}
                      {isMinClicks && (
                        <div title="Lowest clicks" style={badgeStyle('#fff7ed')}>
                          <IconWarning /> <span style={{ fontSize: 11 }}>Low clicks</span>
                        </div>
                      )}
                      {isMinFriction && (
                        <div title="Lowest friction" style={badgeStyle('#ecfdf5')}>
                          <IconTrophy /> <span style={{ fontSize: 11 }}>Low friction</span>
                        </div>
                      )}
                      {isMaxSize && (
                        <div title="Largest size" style={badgeStyle('#fff1f2')}>
                          <IconSize /> <span style={{ fontSize: 11 }}>Largest</span>
                        </div>
                      )}
                    </div>
                  </div>
                </td>

                <td style={tdStyle}>
                  <div style={{ fontWeight: 600 }}>{page.views}</div>
                </td>

                <td style={tdStyle}>
                  <div style={{ display: 'flex', alignItems: 'center', gap: 8 }}>
                    <div style={{ fontWeight: 600 }}>{formatTime(page.visitTime)}</div>
                    {isMinVisit && <div style={{ color: '#0b69ff', fontSize: 12 }}>↓ lowest</div>}
                  </div>
                </td>

                <td style={tdStyle}>
                  <div style={{ display: 'flex', alignItems: 'center', gap: 8 }}>
                    <div style={{ fontWeight: 600 }}>{page.clicks}</div>
                    {isMinClicks && <div style={{ color: '#b45309', fontSize: 12 }}>↓ lowest</div>}
                  </div>
                </td>

                <td style={tdStyle}>
                  <ScrollBar value={page.scroll} />
                </td>

                <td style={tdStyle}>
                  <div style={{ display: 'flex', alignItems: 'center', gap: 8 }}>
                    <div style={{ fontWeight: 600 }}>{page.friction}</div>
                    {isMinFriction && <div style={{ color: '#059669', fontSize: 12 }}>✓ low</div>}
                  </div>
                </td>

                <td style={tdStyle}>
                  <div style={{ display: 'flex', alignItems: 'center', gap: 8 }}>
                    <div style={{ fontWeight: 600 }}>{formatSize(page.size)}</div>
                    {isMaxSize && <div style={{ color: '#dc2626', fontSize: 12 }}>▲ largest</div>}
                  </div>
                </td>
              </tr>
            );
          })}
        </tbody>
      </table>

      {data.length === 0 && (
        <div style={{ marginTop: 12, color: '#667085' }}>No heatmap pages available</div>
      )}
    </div>
  );
}
Next: part 3, Atlassian Confluence.
Useful references
Sitecore
- Marketplace Starter kit: https://github.com/Sitecore/marketplace-starter
- Discover Sitecore Youtube channel: https://www.youtube.com/@DiscoverSitecore
- Marketplace Google Analytics extension: https://github.com/Sitecore/marketplace-google-analytics
- Marketplace SDK with GraphQL queries: https://doc.sitecore.com/mp/en/developers/sdk/latest/sitecore-marketplace-sdk/make-a-graphql-query.html
- Product Design Library: https://blok.sitecore.com/beta
Mouseflow
- Website: https://www.mouseflow.com
- Mouseflow API documentation: https://api-docs.mouseflow.com